
RESEARCH ARTICLE
Estimation of Delay Times in Coupling Between Autonomic Regulatory Loops of Human Heart Rate and Blood Flow Using Phase Dynamics Analysis
Vladimir S Khorev1, Anatoly S Karavaev1, 2, Elena E Lapsheva1, Tatyana A Galushko1, Mikhail D Prokhorov2, Anton R Kiselev1, 3, 4, *
Article Information

Identifiers and Pagination:
Year: 2017Volume: 9
First Page: 16
Last Page: 22
Publisher Id: TOHYPERJ-9-16
DOI: 10.2174/1876526201709010016
Article History:
Received Date: 30/6/2017Revision Received Date: 24/11/2017
Acceptance Date: 17/12/2017
Electronic publication date: 29/12/2017
Collection year: 2017
open-access license: This is an open access article distributed under the terms of the Creative Commons Attribution 4.0 International Public License (CC-BY 4.0), a copy of which is available at: https://creativecommons.org/licenses/by/4.0/legalcode. This license permits unrestricted use, distribution, and reproduction in any medium, provided the original author and source are credited.
Abstract
Objective:
We assessed the delay times in the interaction between the autonomic regulatory loop of Heart Rate Variability (HRV) and autonomic regulatory loop of photoplethysmographic waveform variability (PPGV), showing low-frequency oscillations.
Material and Methods:
In eight healthy subjects aged 25–30 years (3 male, 5 female), we studied at rest (in a supine position) the simultaneously recorded two-hour signals of RR intervals (RRIs) chain and finger photoplethysmogram (PPG). To extract the low-frequency components of RRIs and PPG signal, associated with the low-frequency oscillations in HRV and PPGV with a frequency of about 0.1 Hz, we filtered RRIs and PPG with a bandpass 0.05-0.15 Hz filter. We used a method for the detection of coupling between oscillatory systems, based on the construction of predictive models of instantaneous phase dynamics, for the estimation of delay times in the interaction between the studied regulatory loops.
Results:
Averaged value of delay time in coupling from the regulatory loop of HRV to the loop of PPGV was 0.9±0.4 seconds (mean ± standard error of the means) and averaged value of delay time in coupling from PPGV to HRV was 4.1±1.1 seconds.
Conclusion:
Analysis of two-hour experimental time series of healthy subjects revealed the presence of delay times in the interaction between regulatory loops of HRV and PPGV. Estimated delay time in coupling regulatory loops from HRV to PPGV was about one second or even less, while the delay time in coupling from PPGV to HRV was about several seconds. The difference in delay times is explained by the fact that PPGV to HRV response is mediated through the autonomic nervous system (baroreflex), while the HRV to PPGV response is mediated mechanically via cardiac output.
1. INTRODUCTION
Autonomic regulation of the cardiovascular system plays a crucial role in providing its functioning under various conditions [1]. At the same time, healthy status corresponds to a balance of activity of various regulatory loops during their complex interaction. Failure of autonomic regulation under the influence of external factors is associated with the development of various pathological conditions, for example, hypertension [2]. As it has been shown in our previous studies [3, 4], the peculiarities of interaction between the autonomic regulatory loops are sensitive markers of cardiovascular pathologies, and their results are very promising for the development of diagnostic methods [4-6]. Such studies are important for obtaining fundamental knowledge of structure and mechanisms of the cardiovascular autonomic regulation in healthy subjects and patients with cardiovascular diseases. The development of nonlinear methods for the analysis and signal processing of complex systems has opened up opportunities for investigating complex collective dynamics of regulatory systems and studying the connections between them.
In this study, a promising method for diagnostics of coupling between oscillatory systems, based on the construction of predictive models of instantaneous phase dynamics, is used for the assessment of delay times in the interaction between the autonomic regulatory loop of heart rate variability (HRV) and autonomic regulatory loop of photoplethysmographic waveform variability (PPGV), showing low-frequency oscillations with a basic frequency of about 0.1 Hz. For the first time, such research is carried out for long records of healthy subjects, containing more than 700 characteristic periods. The employment of long records allowed us to improve the statistical properties of estimates for the calculated indices and make new conclusions about the peculiarities of the considered regulatory loops.
2. MATERIAL AND METHODS
2.1. Data Source
This study was approved by the Ethics Committee of the Saratov State Medical University n.a. V.I. Razumovsky in Saratov, Russia, and informed consent was obtained from all participants. We studied eight healthy subjects (five female and three male) aged 25–30 years. The two-hour signals of electrocardiogram (ECG) and photoplethysmogram (PPG) measured on the middle finger of the left hand were simultaneously recorded with one multichannel measurement system (psychophysiological telemetric system “Rehacor-T” with standard sensor package, Medicom MTD Ltd, Taganrog, Russia) in all subjects in a supine position. The PPG was recorded using an optical sensor of reflected light in the infrared range (wavelength is about 960 nm). A standard sensor was used, which is a part of the certified serial multichannel measurement system.
The subjects were studied at rest (in a supine position) in the morning under spontaneous breathing. All signals were sampled at 250 Hz and digitized at 14 bits. From ECG signal, an RR intervals (RRIs) chain, representing a sequence of time intervals between the R-peaks of ECG, was extracted. To obtain equidistant time series from unequidistant RRIs chain, we approximate it with cubic splines and resample with a frequency of 5 Hz. Time series were processed following the recommendations for the standardization and interpretation of the electrocardiogram [7]. Special methods of artifact reduction were not applied.
To extract the low-frequency components of RRIs and PPG signal, associated with the low-frequency oscillations in HRV and PPGV with a frequency of about 0.1 Hz [8], we filtered RRIs and PPG signal by a filter with the bandpass 0.05-0.15 Hz. In previous experiments, in which the subjects were breathing with a linearly increasing frequency, we revealed the self-oscillatory nature of regulatory processes, generating the low-frequency oscillations in PPGV and HRV [9]. In the present paper, regulatory loops of HRV and PPGV were also considered as self-oscillating processes interacting with each other, with delays in coupling.
2.2. Signal Processing
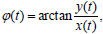
To analyze the coupling between the signals of regulatory loops, we used a method based on the modeling of phase dynamics [10-13]. The main idea of the method is to evaluate how much the future evolution of the phase of one system depends on the current phase value of another system. If taking into account the dynamics of the first system, reduces the prediction error of the model for the individual dynamics of the second system, then the first system has an influence on the second system. Let us calculate at first the instantaneous phases φ(t) of analyzed signals x(t) (RRIs or PPG) as follows:
 |
(1) |
where y(t) is the Hilbert transform of x(t),
 |
(2) |
Using the time series of instantaneous phases φ1(t) and φ2(t), we construct the following predictive models:
 |
(3) |
where Δφk(t)= φk(t+τ)−φk(t), k = 1,2, are the increments of instantaneous phases within the prediction interval τ, εk(t) are the white Gaussian noises, and Fk are trigonometric polynomials:
 |
(4) |
where  is a vector of coefficients, k = 1, 2. The range of summation, i.e. the indices m and n, determining which terms are present in the polynomial, can be different for systems 1 and 2 [10]. The coefficients J1, 2, characterizing the coupling strength for different D values, where D is a time shift between the signals, can be estimated as follows:
 |
(5) |
We used the following parameters of the method in this paper: n = m = 1 [11]. The estimation of the coefficients J1, 2 was accompanied by the calculation of a 95% confidence interval using the analytical formula proposed in Ref [12]. If J1, 2 and its confidence interval is greater than zero, then the coupling between the studied systems is believed to be statistically significant. The presence of local maxima in the dependence J1, 2(D) indicates the presence of delay D in coupling between the systems [11].
The signals of RRIs and PPG from healthy subjects with duration of 120 minutes were analyzed in a moving window. The width of moving window was 20 minutes (about 120 characteristic periods of oscillations) and the window shift was 10 minutes. In each window, the coefficients J1, 2(D) were calculated. The value of D was varied in the range from zero to ten seconds. The dependences J1, 2(D) were statistically significant greater than zero and, as a rule, showed several local maxima, which can be associated with both a delay in interaction and fluctuations caused by the influence of noise, artifacts and various interferences. To reduce the effect of such fluctuations, we averaged the results of data analysis for each of the windows.
3. RESULTS
Typical results of coupling estimation between the regulatory loop of HRV and regulatory loop of PPGV are shown in Fig. (1) for one of the subjects (#5). Here and below, the subscript 1 corresponds to the direction of coupling regulatory loops from HRV to PPGV (Fig. 1a), while subscript 2 corresponds to the direction of coupling from PPGV to HRV (Fig. 1b). The dependence J1(D) in Fig. (1a) has a pronounced maximum for the trial delay Dmax=1.2 s. For the opposite direction of coupling in Fig. (1b), the maximum of J1, 2(D) is located at Dmax=5.2 s.
The Dmax values for both directions of coupling are shown in Fig. (2) for all subjects. Subjects #2–#6 have delay time in coupling from the regulatory loop of HRV to the regulatory loop of PPGV either close to zero or significantly smaller than delay time in coupling from PPGV to HRV (Fig. 2a). Subject #8 has close delay times in both directions. For subject #1, the delay time in coupling from the loop of HRV to the loop of PPGV is greater than delay time in the opposite direction.
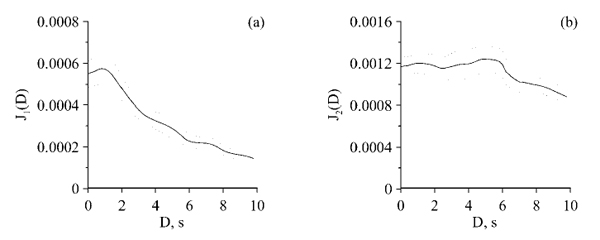 |
Fig. (1). Dependences of coupling coefficients on trial delay time for subject #5 for the case of coupling from regulatory loop of HRV to regulatory loop of PPGV (a) and the case of coupling from PPGV to HRV (b). |
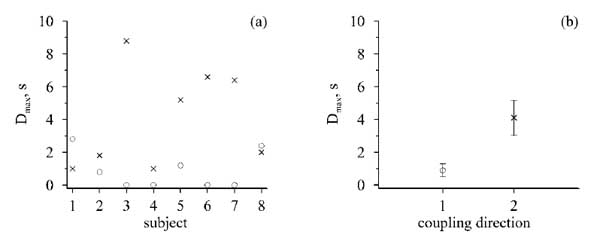 |
Fig. (2). (a) Estimations of delay times for each of the eight subjects. (b) Delay times averaged over the subjects (mean ± standard error of the means). Delay times in coupling from regulatory loop of HRV to regulatory loop of PPGV are shown by circles and delay times in coupling from PPGV to HRV are shown by crosses. |
Fig. (2b) shows the results of average delay times over the subjects. Averaged value of delay times in coupling regulatory loops from HRV to PPGV is 4.1±1.1 seconds (data presented as mean ± standard error of the means). This value is significantly greater than the averaged value of delay times in coupling from HRV to PPGV, which is equal to 0.9±0.4 seconds.
We revealed no dependence of our results on gender and age of studied subjects.
4. DISCUSSION
The methods of coupling detection based on the analysis of phase dynamics are highly sensitive in the case of weak coupling, but require long time series. The employment of short time series (less than 100 characteristic periods) leads to a large fluctuation in the estimates of coupling strength and delay and to biases of such estimates [13]. Therefore, interpretation of the results of signal analysis in living systems requires a special care, since the dynamics of these systems is characterized by a change of their parameters in time and the signals of the systems are noisy and usually have artifacts. Moreover, it is often difficult or even impossible to obtain experimental signals of sufficient duration for technical and ethical reasons.
Surprisingly, few research works have been devoted to the study of delay times between the elements of the cardiovascular system. One of them explains the biophysical origin of 0.1 Hz oscillations in the HRV as a result of baroreflex regulation of blood pressure. Blood pressure oscillations with the characteristic period about 10 seconds are caused mostly by sympathetic modulation of vascular resistance that acts as a stimulus for the baroreceptors [14]. The baroreflex responds to blood pressure amplification with heart rate decline and vasodilatation, which, in turn, produces a decrease in blood pressure. Vaschillo et al. [15] proved the delay in blood pressure changes following heart rate change every five seconds at average, thus yielding the ubiquitous oscillation of about 10 seconds in HRV. Taking into account that oscillations in blood supply in digital arteries contribute significantly to the photoplethysmographyc signal in fingers [16], we can be sure that it is possible to study the regulation of systemic blood pressure using PPGV.
A number of studies are known, in which the elements of autonomous regulation of blood circulation are described in the form of closed-loop delayed feedback systems [17-19]. The importance of having a closed feedback loop for the stable functioning of the circuits of autonomous regulation of blood circulation is emphasized in some papers [20, 21]. At the same time, such organization of autonomic regulatory loops does not exclude the presence of delays in couplings between the individual closed-loop delayed feedback systems. For example, similar architecture of interactions within the multi-element system is often taken into account in studies of higher nervous activity [22]. Considering that, we assume that BPV and HRV processes can be considered as self-oscillatory closed-loop systems, with the time-delays in the information pathways between these systems.
In our previous study [23], the presence of delayed coupling between the regulatory loops of HRV and PPGV has been shown during the analysis of 10-minute records from healthy subjects and patients with myocardial infarction, and conclusion has been made in favor of the presence of a predominant direction of coupling from HRV to PPGV.
In the present study, considerably longer records from healthy subjects were analyzed (more than 700 characteristic oscillation periods for each subject versus 60 periods in the study [23]). As a result, we significantly reduced the fluctuations in the estimates of coefficients J1, 2 in comparison with earlier studies. It allowed us to assess the delay times in coupling with an accuracy of about one second. The obtained results show that the impact of low-frequency oscillations in HRV on similar oscillations in PPGV resulted in a small delay, since the delay time in coupling is usually less than one second. The delay time in coupling from the regulatory loop of PPGV to the regulatory loop of HRV was observed to be much longer and its averaged value was observed to be about four seconds. The difference in delay times can be explained by the fact that PPGV to HRV response is mediated through the autonomic nervous system (baroreflex), while the HRV to PPGV response is mediated mechanically via cardiac output. Large absolute values of delay times in coupling from HRV to PPGV for subjects #1 and #8 were probably the result of measurement noise and artifacts.
Previously Cevese et al. [24] with the help of cross-spectral analysis showed the presence of negative phase shift between RRIs and systolic blood pressure, which indicated a 1–2 seconds lag in heart period changes in relation to pressure. In our study, we obtained larger delay times in coupling from the regulatory loop of PPGV to HRV. This can be explained by the higher accuracy of the estimates provided by the nonlinear analysis method we used [25, 26].
However, despite few studies, the delays between the regulation loops of heart rate and blood pressure, which we investigated through PPGV analysis, remain briefly studied. We assume that the estimates of delay times in the interaction between the elements of the autonomic regulatory system may be potentially useful in studying some autonomic dysfunctions and other diseases. For example in another paper [27], the authors showed that the delays between blood pressure and heart rate in patients with end-stage kidney disease increased in renal insufficiency.
CONCLUSION
Analysis of two-hour experimental time series of healthy subjects revealed the presence of different delay times in the interaction between the regulatory loops, showing low-frequency oscillations in HRV and PPGV. The delay time in coupling from the regulatory loop of HRV to the regulatory loop of PPGV is about one second, while the delay time in coupling in the opposite direction is about several seconds. This difference in delay times can be explained by the fact that PPGV to HRV response is mediated through the autonomic nervous system (baroreflex), while the HRV to PPGV response is mediated mechanically via cardiac output.
ETHICAL APPROVAL AND CONTENT TO PARTICIPATE
This study was approved by the Ethics Committee of the Saratov State Medical University n.a. V.I. Razumovsky in Saratov, Russia. We studied eight healthy subjects (five female and three male) aged 25–30 years.
HUMAN AND ANIMAL RIGHTS
No animals were used in this research. All research procedures followed were in accordance with the ethical standards of the committee responsible for human experimentation (institutional and national), and with the Helsinki Declaration of 1975, as revised in 2008 (http://www.wma.net/en/20activities/10ethics/10helsinki/)
CONSENT FOR PUBLICATION
Informed consent was obtained from all participants.
CONFLICT OF INTEREST
The authors declare no conflict of interest, financial or otherwise.
ACKNOWLEDGEMENTS
This work was supported by Russian Science Foundation, grant No. 14-12-00291 (nonlinear analysis of coupling), and by the President of the Russian Federation, grant No. MD-3318.2017.7 (physiological experiment).