
RESEARCH ARTICLE
Characteristics of Syrian and Lebanese Diabetes and Hypertension Patients in Lebanon
Shannon Doocy1, *, Emily Lyles1, Zeina Fahed2, Abdalla Mkanna2, Kaisa Kontunen2, Gilbert Burnham1
Article Information

Identifiers and Pagination:
Year: 2018Volume: 10
First Page: 60
Last Page: 75
Publisher Id: TOHYPERJ-10-60
DOI: 10.2174/1876526201810010060
Article History:
Received Date: 31/8/2018Revision Received Date: 31/10/2018
Acceptance Date: 9/11/2018
Electronic publication date: 24/12/2018
Collection year: 2018
open-access license: This is an open access article distributed under the terms of the Creative Commons Attribution 4.0 International Public License (CC-BY 4.0), a copy of which is available at: (https://creativecommons.org/licenses/by/4.0/legalcode). This license permits unrestricted use, distribution, and reproduction in any medium, provided the original author and source are credited.
Abstract
Background:
Given the protracted nature of the crisis in Syria, the large caseload of Syrian refugee patients with non-communicable diseases, and the high costs of providing non-communicable disease care, implications for Lebanon’s health system are vast.
Objective:
To provide a profile of the health status of diabetes and hypertension patients enrolled in a longitudinal cohort study in Lebanon.
Methods:
A longitudinal cohort study was implemented from January 2015 through August 2016 to evaluate the effectiveness of treatment guidelines and an mHealth application on the quality of care and health outcomes for patients in primary health care facilities in Lebanon offering low-cost services serving both Syrian refugees and Lebanese host communities. This paper presents baseline characteristics of enrolled patients, providing an overall health status profile.
Results:
Among participants, 11.5% of patients with hypertension and 9.7% of patients with diabetes were previously undiagnosed. Quality of care, measured as the proportion of patients with biometrics reported and whose condition is controlled, is less than ideal and varied by geographic location. Controlled blood pressure measurements were observed in 64.2% of patients with hypertension; HbA1C values indicated diabetes control in 43.5% of the patients.
Conclusion:
Differences in diagnostic history and disease control between Syrian and Lebanese patients and across geographic regions were observed, which could be applied to inform strategies aimed at improving diagnosis and quality of care for hypertension and diabetes in primary care settings in Lebanon.
1. INTRODUCTION
The Syrian Civil War, which began in March 2011, has resulted in widespread displacement with more than 6.5 million Syrians internally displaced and an exodus of over five million refugees to countries throughout the region [1]. Lebanon, with just over one million Syrian refugees and an estimated 183 refugees per 1,000 inhabitants, has the largest number of refugees in relation to its host population worldwide [2]. There are no formal Syrian refugee camps in Lebanon. Rather, refugees are integrated with host communities and reside in a variety of settings including rented accommodations, informal settlements (ITS), staying with host families, and other transitional housing in towns and cities.
Like many countries in the region, Lebanese and Syrian populations are in the late stages of epidemiologic transition from communicable, maternal, neonatal, and nutritional conditions to Non-Communicable diseases (NCDs) [3-7]. Type 2 diabetes prevalence is estimated at 8.8% in Syria and 14.9% in Lebanon [8-14]. Previous publications have estimated regional prevalence of hypertension at 29.5%, prevalence in Syria at 24.9%, and in Lebanon at 28.8% [15-18]. Syrian refugees are no exception to the Middle East’s high NCD burden. The United Nations High Commissioner for Refugees (UNHCR) estimates that 14.6% of adult Syrian refugees in Lebanon have a chronic disease and two similar surveys found that 39.8% and 43.4% of Syrian refugee households in Jordan had at least one household member with a chronic health condition (including hypertension, cardiovascular disease, diabetes, chronic respiratory disease, and arthritis) [18, 19]. While estimates of chronic disease prevalence specifically among Syrian refugees in the region are few, the most recently published rates among adult Syrian refugees in Jordan (2015) estimated 9.7% prevalence for hypertension and 5.3% for diabetes. Comparable figures for Lebanon (published in 2016) are similar at 7.4% for hypertension and 3.3% for diabetes [18-21].
With refugees now accounting for one in four people in Lebanon, the increased burden on the country’s fragmented, privatized, and specialist-driven health system is immense and brings financial demands in addition to amplifying infrastructure, capacity, and resource allocation needs [22, 23]. In response to the Syrian crisis, UNHCR established an inter-agency mechanism with the Lebanese government to coordinate the humanitarian response across all sectors. Delivery of health services for Syrian refugees in Lebanon is based on a primary health care strategy. As of August 2015, Syrian refugees registered with UNHCR could utilize primary healthcare services with subsidized fees at approximately 116 of more than 1,200 existing Primary Healthcare Centers (PHCs)/dispensaries across the country, including existing Ministry of Public Health (MoPH) PHCs [24-30].
On top of the Syrian refugee crisis unfolding, a second crisis has emerged concerning the effect of the refugee influx on Lebanese host communities. The majority (86%) of Syrian refugees in Lebanon reside in communities already hosting 66% of the most vulnerable Lebanese populations [31]. Despite priority setting and investment in local and national stability, striking disparities between Syrian refugee and host community populations in Lebanon, specifically related to vulnerability, health status, and access to health care, have been noted in a number of studies [21, 32-35]. Perceptions of inequitable aid distribution and access to basic services in favor of refugees have furthered tensions between refugee and host communities, contributing to increased instability and challenges to international assistance actors and the Lebanese government alike. Despite Lebanon’s relatively small size geographically, there is immense diversity not only among the various populations residing in the country, but also across governorates including a number of previously noted factors associated with geographic differences in communities’ health care utilization and overall health status [36]. Such dissimilarities present added challenges in appropriately meeting the health needs of both refugee and host communities throughout Lebanon.
Given the protracted nature of the crisis, the high cost of providing NCD care, and the large caseload of Syrian refugees with NCDs, implications for Lebanon’s health system are substantial. In light of this, we undertook a study to evaluate the effectiveness of treatment guidelines and an mHealth application on quality of care and health outcomes for patients in primary care settings. In this paper, we present the baseline characteristics of Syrian refugee and Lebanese patients enrolled in the study, which provides a profile of the health status of patients with type 2 diabetes and hypertension at primary health care facilities offering low-cost services in Lebanon.
2. METHODS
2.1. Study Objectives and Aims
This paper presents an overview of characteristics of Syrian refugee and Lebanese patients enrolled in a longitudinal cohort study implemented from January 2015 through August 2016 in primary health care facilities in Lebanon that serve both populations. The main study had two research aims: (1) to adapt and evaluate the use of existing standards and guidelines for treatment, including counselling, of patients with hypertension and type 2 diabetes (or both); and (2) to evaluate the effectiveness of an mHealth application incorporating the aforementioned guidelines that functioned as a decision support tool for providers.
2.2. Participants
The study used a phased introduction of the clinical guidelines and mHealth interventions over a period of 20 months with longitudinal measurement of study outcomes presented elsewhere [37, 38]. Participants consisted of patients at ten health care centers in Lebanon supported by International Organization for Migration (IOM) and International Medical Corps (IMC) in the South, Bekaa, Beirut, and Mount Lebanon governorates Fig. (1). Patients at these locations include Syrian refugees, Lebanese populations, and other nationalities in smaller number, including Iraqi refugees and Armenian populations; individuals of all nationalities were eligible to participate so long as they met inclusion criteria (i.e. the sample was not randomly selected). Individuals without hypertension or type 2 diabetes diagnosis, those less than 40 years of age, and adults lacking the capacity to independently participate in interviews were excluded. In this paper, a profile of the health status of enrolled diabetes and hypertension patients at baseline is presented exploring differences in key indicators by geographic location and between Syrian refugee and Lebanese host community patients.
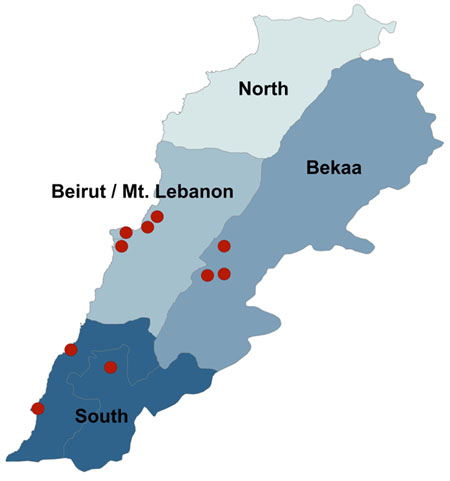 |
Fig. (1). Participating Primary Health Centers by Geographic Area. |
2.3. Sample Size
The sample size was estimated for the main study based on reported clinic caseloads, and the anticipated proportions of patients that could be reached by phone (80%) and who would consent to participate (90%). Based on these assumptions, the projected maximum sample size was 1609 participants. Over-estimation of current caseloads resulted in lower actual enrollment; a total of 1010 participants were enrolled and 793 (78%) completed the study. Sample size calculations for the main study were based on the objective of improved quality of care, specifically the proportion of providers that adhere to treatment guidelines, and assumed a baseline rate of 50% for adherence to guidelines (the most conservative rate that would ensure the ability to detect significant differences from all other rates). Sample size calculations were performed using Stata 13, assumed α = 0.05, β = 0.20 (power = 0.80) and were one-sided based on the assumption that quality of care will not decrease as a result of the intervention.
2.4. Data Collection
This study was designed using a mixed method approach with qualitative and quantitative data collected throughout. Patients with hypertension or type 2 diabetes were approached at clinics where they received care. If they indicated an interest in participation, a follow-up phone call was made where verbal informed consent was obtained and documented in survey forms. Verbal informed consent was obtained with approval of the Institutional Review Board at The Johns Hopkins Bloomberg School of Public Health because interviews were conducted over the phone, and as such, did not include in-person contact between the study team and patients, and also because of high levels of illiteracy in the Syrian population, especially among older adults and women. Data were collected with tablets using the Magpi mobile data platform by DataDyne LLC (Washington, DC). The baseline interview collected information on demographic characteristics; medical history and recent care seeking behaviors; and knowledge, attitudes, and practices related to diabetes and/or hypertension. Existing surveys from Lebanon and the region were reviewed during the questionnaire design process to identify relevant questions for inclusion that would enable comparison between study findings and national/regional statistics. Medical record reviews were also conducted for each patient following consent and enrollment when information related to provider compliance with guidelines and quality of care; frequency of visits; generic patient outcomes (death and loss to follow-up), and disease-specific patient outcomes (complications and adverse events of hypertension and diabetes) was collected.
2.5. Data Analysis
Data were analyzed using Stata 13 (College Station, TX) using descriptive statistics and standard methods for comparison of means and proportions. Blood pressure was monitored among patients with hypertension; the HbA1C test was the preferred measure to monitor patients with diabetes, but when not available, random or fasting blood sugar was used [39-41]. A sequenced process based on patient report, clinical data, and reported prescriptions was applied to assign a uniform diagnosis to patients in cases where reporting was inconsistent over time; eight patients remained with an unclassified diagnosis and were subsequently dropped from final analysis to ensure reliable reporting by condition. Condition control was defined for patients with type 2 diabetes as having HbA1C less than seven percent. For patients with hypertension, condition control was characterized as systolic blood pressure greater than 140 and/or diastolic blood pressure greater than 90mmHg. Differences in patient demographic characteristics as well as diagnostic and care history by population group, geographic region, and condition control status were examined using chi-square and t-test methods. Logistic regression was utilized to determine univariate associations between patient background characteristics and blood pressure control. A multivariate logistic regression model was then developed based on a priori theory adjusting for all covariates of interest. Given the insufficient sample size of patients for whom HbA1C test results were available and the distribution of covariates of interest, regression analysis was not conducted for diabetes control. Financial indicators are presented to the nearest U.S. Dollar (US$) using an exchange rate of 1,507.5 Lebanese Pounds/US$ [42].
3. RESULTS
A total of 2,295 individuals were contacted to participate using information provided by study health facilities. Of these, 21.6% (n=498) provided an incorrect phone number, 25.7% (n=592) were unavailable or unable to be reached by phone, 3.9% (n=89) did not meet study criteria, 4.5% (n=104) refused to participate, and 0.1% (n=2) were deceased since the recorded care visit. A total of 1,010 individuals (43.8%) were enrolled and included in the analysis, including 637 Syrian refugees (63.1%), 330 Lebanese (32.6%), and 43 individuals of other nationalities (4.3%).
3.1. Sociodemographic Characteristics
More than half (64.0%) of enrolled patients were female and the average age at enrollment was 58.2 (CI: 57.6-58.8) years. Lebanese were significantly older than Syrian refugees (60.5 years vs. 56.8 years, p<0.001) and patients in Beirut/Mt Lebanon were significantly older than in the South and the Bekaa (p<0.001). Lebanese patients had significantly higher educational attainment than refugees with 14.0% completing secondary education or higher as compared to only 6.8% of Syrian refugees (p<0.001); educational attainment also differed significantly by region and was highest in Beirut/Mt Lebanon (p<0.001). Mean household income and expenditures in the month preceding enrolment were US$328 (median US$262, range US$0-2141) and US$672 (median US$619, range US$0-3070), respectively. Income was significantly higher among Lebanese (mean US$386, median US$332) as compared to Syrians (mean US$288, median US$232) and was also significantly higher in Beirut/Mt Lebanon than in the South and the Bekaa. Sale of assets and borrowing, indicative of financial distress, were reported by 13.2% and 57.1% of respondents, respectively with an average debt of US$960 (median US$464, range US$0-10841); borrowing and debt both differed significantly by location (p<0.001). Syrian refugees were 0.31 (CI: 0.19-0.51) times less likely to sell assets and 0.21 times less likely (CI: 0.15-0.27) to borrow money than Lebanese, however, the average debt of Lebanese significantly exceeded that of Syrians (US$1919 vs US$732, p<0.001). Patient sociodemographic characteristics are presented in Table 1.
| Overall (n=1,010) | By Region | P-value for regional comparisona | By Population | P-value for population comparisona | |||||||||||
|---|---|---|---|---|---|---|---|---|---|---|---|---|---|---|---|
| South (n=265) | Bekaa (n=394) | GB/ML (n=351) | Syrian (n=637) | Lebanese (n=330) | |||||||||||
| Point | 95% CI | Point | 95% CI | Point | 95% CI | Point | 95% CI | Point | 95% CI | Point | 95% CI | ||||
| Demographic Characteristics | |||||||||||||||
| Sex | |||||||||||||||
| Male | 36.0% | (33.1-39.1%) | 34.7% | (29.0-40.8%) | 33.5% | (28.9-38.4%) | 39.9% | (34.7-45.2%) | 0.169 | 33.0% | (29.3-36.8%) | 42.1% | (36.7-47.7%) | 0.005 | |
| Female | 64.0% | (60.9-66.9%) | 65.3% | (59.2-71.0%) | 66.5% | (61.6-71.1%) | 60.1% | (54.8-65.3%) | 67.0% | (63.2-70.7%) | 57.9% | (52.3-63.3%) | |||
| Age | Median | 57 | 56 | 57 | 59 | 56 | 60 | ||||||||
| Mean | 58.19 | (57.56-58.82) | 56.9 | (55.66-58.13) | 57.66 | (56.67-58.65) | 59.75 | (58.66-60.85) | 0.001 | 56.8 | (56.03-57.56) | 60.51 | (59.38-61.64) | <0.001 | |
| Highest Level of Education Completed | |||||||||||||||
| Less than Primary | 67.5% | (64.5-70.3%) | 71.7% | (65.9-77.0%) | 73.5% | (68.8-77.8%) | 57.6% | (52.2-62.8%) | < 0.001 | 70.9% | (67.2-74.4%) | 62.3% | (56.8-67.6%) | 0.002 | |
| Primary | 23.0% | (20.4-25.7%) | 21.9% | (17.1-27.4%) | 20.2% | (16.3-24.5%) | 27.1% | (22.5-32.0%) | 22.3% | (19.1-25.8%) | 23.7% | (19.2-28.7%) | |||
| Secondary | 7.0% | (5.5-8.8%) | 5.3% | (2.9-8.7%) | 4.6% | (2.7-7.2%) | 11.1% | (8.0-14.9%) | 4.9% | (3.3-6.8%) | 10.6% | (7.5-14.5%) | |||
| University or higher | 2.5% | (1.6-3.6%) | 1.1% | (0.2-3.3%) | 1.8% | (0.7-3.6%) | 4.3% | (2.4-7.0%) | 1.9% | (1.0-3.3%) | 3.3% | (1.7-5.9%) | |||
| Marital Status | |||||||||||||||
| Married | 81.3% | (78.7-83.6%) | 81.1% | (75.9-85.7%) | 84.0% | (80.0-87.5%) | 78.4% | (73.7-82.5%) | 0.014 | 81.6% | (78.4-84.6%) | 79.4% | (74.6-83.6%) | 0.006 | |
| Widowed | 14.6% | (12.4-16.9%) | 14.7% | (10.7-19.6%) | 12.7% | (9.6-16.4%) | 16.5% | (12.8-20.8%) | 15.7% | (13.0-18.8%) | 13.6% | (10.1-17.8%) | |||
| Never Married | 2.8% | (1.8-4.0%) | 1.9% | (0.6-4.3%) | 1.5% | (0.6-3.3%) | 4.8% | (2.8-7.6%) | 1.4% | (0.6-2.7%) | 5.2% | (3.0-8.1%) | |||
| Divorced | 1.4% | (0.8-2.3%) | 2.3% | (0.8-4.9%) | 1.8% | (0.7-3.6%) | 0.3% | (0.0-1.6%) | 1.3% | (0.5-2.5%) | 1.8% | (0.7-3.9%) | |||
| Population Group | |||||||||||||||
| Syrian Refugee | 63.1% | (60.0-66.1%) | 68.7% | (62.7-74.2%) | 71.6% | (66.8-76.0%) | 49.3% | (43.9-54.6%) | < 0.001 | ||||||
| Host Lebanese | 32.7% | (29.8-35.7%) | 30.2% | (24.7-36.1%) | 26.7% | (22.3-31.3%) | 41.3% | (36.1-46.7%) | |||||||
| Other | 4.3% | (3.1-5.7%) | 1.1% | (0.2-3.3%) | 1.8% | (0.7-3.6%) | 9.4% | (6.6-12.9%) | |||||||
| Household Economyb | |||||||||||||||
| Expenditures (past month) | |||||||||||||||
| Total Expenditures | Median | 619 | 567 | 529 | 734 | 618 | 624 | ||||||||
| Mean | 671.5 | (645.6-697.4) | 651.7 | (606.8-696.7) | 589.5 | (552.8-626.2) | 780.7 | (730.2-831.2) | < 0.001 | 659.1 | (628.2-690.1) | 690.0 | (641.3-738.6) | 0.275 | |
| Income (past month) | |||||||||||||||
| Total Income | Median | 262 | 332 | 133 | 398 | 232 | 332 | ||||||||
| Mean | 326.8 | (304.2-349.5) | 369.5 | (322.6-416.4) | 218.2 | (192.9-243.6) | 415.9 | (371.8-460.0) | < 0.001 | 288.2 | (265.9-310.5) | 385.8 | (336.4-435.3) | < 0.001 | |
| Economic Coping Strategies (in past 3 months) | |||||||||||||||
| Sold assets to pay for HH expenses | 13.2% | (11.2-15.4%) | 13.2% | (9.4-17.9%) | 11.7% | (8.7-15.3%) | 14.8% | (11.3-19.0%) | 0.568 | 17.1% | (14.3-20.3%) | 6.1% | (3.7-9.2%) | < 0.001 | |
| Borrowed money to pay for HH expenses | 57.1% | (54.0-60.2%) | 58.1% | (51.9-64.1%) | 62.8% | (57.9-67.6%) | 49.9% | (44.5-55.2%) | < 0.001 | 71.5% | (67.9-75.0%) | 34.5% | (29.4-39.9%) | < 0.001 | |
| Debt Currently Owed | Median | 464 | 398 | 431 | 531 | 398 | 663 | ||||||||
| Mean | 960.1 | (836.0-1084.1) | 897.3 | (646.5-1148.0) | 796.2 | (635.3-957.1) | 1235.2 | (981.6-1488.8) | 0.011 | 732.0 | (631.7-832.2) | 1919.1 | (1452.6-2385.5) | < 0.001 | |
a Independent t-test for continuous variables, Chi-square test for categorical variables b all financial figures presented in US$
3.2. Diagnostic and Condition History
3.2.1. Hypertension
Among participants, 87.5% (CI: 85.3-89.5) reported having been diagnosed with hypertension at or before the time of enrollment. Hypertension diagnosis was similar by nationality but differed by region with the highest proportion in Beirut/Mount Lebanon and the lowest in the South (94.3% vs 80.0%, p<0.001). Most hypertension participants (88.5%) were diagnosed prior to the facility visit prompting eligibility for study enrollment with an overall average of 7.8 years since initial diagnosis. A significantly higher proportion of Lebanese patients reported a prior diagnosis of hypertension as compared to Syrians (93.2% vs 85.5%, p=0.002) and accordingly had significantly longer average time since diagnosis (9.2 vs 7.2 years, p<0.001). All patients with hypertension reported having ever been prescribed medication for their condition and 98.1% (CI: 96.9-99.0) reported taking medication at the time of interview. Interrupted medication use was relatively low with only 9.3% (CI: 7.3-11.6) of patients prescribed medication for hypertension reporting having stopped the medication for two weeks or more in the three-month period preceding enrollment. Interruption of medication use was significantly higher among Syrian refugees as compared to Lebanese (13.3% vs 2.4%, p<0.001) and was higher in the Bekaa (13.3%) than the South (10.6%) and Beirut/Mount Lebanon (4.3%) (p=0.001). Diagnosis and medication history for hypertension and diabetes is presented in Table 2.
| Overall (n=1,010) | By Region | P-value for regional comparisona | By Population | P-value for population comparisona | ||||||||||
|---|---|---|---|---|---|---|---|---|---|---|---|---|---|---|
| South (n=265) | Bekaa (n=394) | GB/ML (n=351) | Syrian (n=637) | Lebanese (n=330) | ||||||||||
| Point | 95% CI | Point | 95% CI | Point | 95% CI | Point | 95% CI | Point | 95% CI | Point | 95% CI | |||
| Hypertension (HT) History | ||||||||||||||
| Ever diagnosed with HTb | 87.5% | (85.3-89.5%) | 80.0% | (74.7-84.6%) | 86.6% | (82.8-89.8%) | 94.3% | (91.3-96.5%) | < 0.001 | 86.7% | (83.8-89.2%) | 89.4% | (85.6-92.5%) | 0.221 |
| HT diagnosis at most recent visitc | n=803 | n=196 | n=312 | n=295 | n=509 | n=265 | ||||||||
| At most recent visit | 11.5% | (9.3-13.9%) | 14.8% | (10.1-20.6%) | 8.3% | (5.5-12.0%) | 12.5% | (9.0-16.9%) | 0.064 | 14.5% | (11.6-17.9%) | 6.8% | (4.1-10.5%) | 0.002 |
| No, diagnosed before most recent visit | 88.5% | (86.1-90.7%) | 85.2% | (79.4-89.9%) | 91.7% | (88.0-94.5%) | 87.5% | (83.1-91.0%) | 85.5% | (82.1-88.4%) | 93.2% | (89.5-95.9%) | ||
| Years since HT diagnosisd | n=750 | n=178 | n=291 | n=281 | n=470 | n=253 | ||||||||
| Median | 6 | 5 | 6 | 6 | 5 | 7 | ||||||||
| Mean | 7.81 | (7.34-8.28) | 6.98 | (6.01-7.96) | 7.73 | (7.01-8.45) | 8.42 | (7.62-9.23) | 0.069 | 6.96 | (6.39-7.53) | 9.19 | (8.35-10.03) | < 0.001 |
| Medication | n=873 | n=206 | n=337 | n=330 | n=543 | n=293 | ||||||||
| Ever prescribed medication | 100% | (99.5-100%) | 100% | (98.1-100%) | 100% | (98.8-100%) | 100% | (98.8-100%) | - | 100% | (99.3-100%) | 100% | (98.6-100%) | - |
| Currently taking hypertension medication | 98.1% | (96.9-99.0%) | 98.9% | (96.0-99.9%) | 98.0% | (95.6-99.2%) | 97.9% | (95.4-99.2%) | 0.701 | 98.1% | (96.4-99.1%) | 98.0% | (95.5-99.4%) | 0.960 |
| Stopped taking medicines for 2+ weeks in the past 3 months | 9.3% | (7.3-11.6%) | 10.6% | (6.5-16.1%) | 13.3% | (9.6-17.7%) | 4.3% | (2.2-7.3%) | 0.001 | 13.3% | (10.4-16.7%) | 2.4% | (0.9-5.1%) | < 0.001 |
| Diabetes (DM) History | ||||||||||||||
| Ever diagnosed with DMb | 53.5% | (50.3-56.6%) | 52.8% | (46.6-59.0%) | 53.3% | (48.2-58.3%) | 54.1% | (48.8-59.4%) | 0.947 | 49.0% | (45.0-52.9%) | 60.9% | (55.4-66.2%) | < 0.001 |
| DM diagnosis at most recent visitc | n=506 | n=135 | n=196 | n=175 | n=287 | n=194 | ||||||||
| At most recent visit | 9.7% | (7.3-12.6%) | 14.8% | (9.3-21.9%) | 6.1% | (3.2-10.5%) | 9.7% | (5.8-15.1%) | 0.032 | 11.9% | (8.3-16.2%) | 6.7% | (3.6-11.2%) | 0.062 |
| No, diagnosed before most recent visit | 90.3% | (87.4-92.7%) | 85.2% | (78.1-90.7%) | 93.9% | (89.5-96.8%) | 90.3% | (84.9-94.2%) | 88.2% | (83.8-91.7%) | 93.3% | (88.8-96.4%) | ||
| Years since DM diagnosisd | n=448 | n=111 | n=179 | n=158 | n=247 | n=178 | ||||||||
| Median | 7 | 7 | 7 | 8 | 6 | 10 | ||||||||
| Mean | 8.9 | (8.2-9.5) | 8.3 | (7.0-9.7) | 8.8 | (7.7-9.8) | 9.5 | (8.4-10.7) | 0.386 | 7.8 | (7.0-8.6) | 10.8 | (9.6-11.9) | < 0.001 |
| Medication | n=537 | n=139 | n=208 | n=190 | n=309 | n=201 | ||||||||
| Ever prescribed medication | 99.8% | (98.9-100%) | 99.3% | (96.0-100%) | 100% | (98.1-100%) | 100% | (98.1-100%) | 0.242 | 100% | (98.8-100%) | 99.5% | (97.3-100%) | 0.215 |
| Currently taking diabetes medication | 96.4% | (94.4-97.9%) | 95.6% | (90.6-98.4%) | 98.0% | (94.9-99.4%) | 95.4% | (91.2-98.0%) | 0.342 | 96.5% | (93.7-98.3%) | 97.4% | (94.1-99.2%) | 0.575 |
| Stopped taking medicines for 2+ weeks in the past 3 months | 7.5% | (5.4-10.2%) | 10.4% | (5.8-16.8%) | 8.2% | (4.7-12.9%) | 4.6% | (2.0-8.8%) | 0.143 | 10.8% | (7.5-15.0%) | 2.6% | (0.8-5.9%) | 0.001 |
a Independent t-test for continuous variables, Chi-square test for categorical variables
b Among all enrolled patients (hypertensive and/or diabetic)c Among patients ever diagnosed with named condition d Among patients not diagnosed at most recent study clinic visit.
3.2.2. Type 2 Diabetes
Type 2 diabetes was less prevalent than hypertension among study patients with 53.5% (CI: 50.3-56.6) reporting having been diagnosed with type 2 diabetes at or before the time of enrollment. Type 2 diabetes diagnosis was significantly more frequent among Lebanese than Syrians (60.9% vs 49.0%, p<0.001), but similar across geographic regions. Most enrolled patients with diabetes (90.3%) were diagnosed prior to the time of the study enrollment with an overall average of 8.9 years since diagnosis. The mean time since diagnosis was significantly longer among Lebanese as compared to Syrians (10.8 vs 7.8 years, p<0.001). While prior diabetes diagnosis was similar by nationality, significant differences were observed by region; the highest proportion of patients with a prior diagnosis was in the Bekaa (93.9%) and the lowest in the South (85.2%) (p=0.032). Prescription of medication for type 2 diabetes was nearly universal; 99.8% (CI: 98.9-100) of patients with diabetes reported ever being prescribed medication for the condition, of whom 96.4% (CI: 94.4-97.9) reported current medication use at the time of interview. As in patients with hypertension, interrupted medication use for type 2 diabetes was low with only 7.5% (CI: 5.4-10.2) of patients prescribed medication reporting stopping the medication for two weeks or more in the three-month period preceding the enrollment interview. Interrupted medication use was significantly higher among Syrian refugees as compared to Lebanese (10.8% vs 2.6%, p<0.001) but was similar across geographic regions.
3.3. Disease Control
Control of disease at baseline was determined using measures such as body mass index (BMI), total cholesterol, blood pressure, and HbA1C recorded in patient records (Tables 3 and 4). Reporting varied across the ten study clinics for BMI and cholesterol, resulting in data too incomplete to characterize the study population and sample sizes too small for comparison by region and nationality. Only 7.7% (CI: 6.0-9.7) of patients had a BMI measurement recorded at baseline, among which the average BMI was 33.5 kg/m2 (CI: 31.9-35.1; median=32.8). Among those with BMI reported, 7.5% were normal, 22.4% overweight, and 70.1% obese. Fewer than one-third (30.2%, CI: 27.2-33.4) of patients had total cholesterol values recorded. Cholesterol values were recorded most commonly in Beirut/Mt Lebanon (46.2%) and least in the Bekaa (12.2%); Lebanese patients were significantly more likely to have cholesterol values reported compared to Syrians (44.5% vs 29.4%, p=0.003). The average total cholesterol value was 204mg/dL (CI: 198-210; median=202); 46.4% had cholesterol levels in the goal range (<200mg/dL), 33.1% were in the somewhat elevated range (200-239mg/dL) and 20.5% were substantially increased (≥240mg/dL).
| Overalla | By Region | P-value for regional comparisonb | By Population | P-value for population comparisonb | |||||||||||||
|---|---|---|---|---|---|---|---|---|---|---|---|---|---|---|---|---|---|
| (n=870) | South (n=260) | Bekaa (n=279) | GB/ML (n=331) | Syrian(n=637) | Lebanese (n=330) | ||||||||||||
| Point | 95% CI | Point | 95% CI | Point | 95% CI | Point | 95% CI | Point | 95% CI | Point | 95% CI | ||||||
| BMIc | n=870 | n=260 | n=279 | n=331 | n=405 | n=218 | |||||||||||
| Total % patients with BMI measured | 7.7% | (6.0-9.7%) | 4.2% | (2.1-7.4%) | 0% | (0.0-1.3%) | 16.9% | (13.0-21.4%) | < 0.001 | 10% | (7.4-13.5%) | 11.9% | (7.9-17.0%) | 0.488 | |||
| n=67 | n=11 | n=0 | n=56 | n=41 | n=26 | ||||||||||||
| Mean | 33.46 | (31.85-35.08) | 31.71 | (27.26-36.15) | - | - | 33.81 | (32.04-35.58) | 0.339 | 33.12 | (31.00-35.24) | 34.01 | (31.36-36.65) | 0.598 | |||
| BMI < 25 kg/m2 (normal) - “GOAL” | 7.5% | (2.5-16.6%) | 9.1% | (0.2-41.3%) | - | - | 7.1% | (2.0-17.3%) | 0.875 | 7.3% | (1.5-19.9%) | 7.7% | (0.9-25.1%) | 0.885 | |||
| BMI > 25kg/m2 (overweight) - “CAUTION”” | 22.4% | (13.1-34.2%) | 27.3% | (6.0-61.0%) | - | - | 21.4% | (11.6-34.4%) | 24.4% | (12.4-40.3%) | 19.2% | (6.6-39.4%) | |||||
| BMI > 30kg/m2 (obese) - “HIGH RISK” | 70.1% | (57.7-80.7%) | 63.6% | (30.8-89.1%) | - | - | 71.4% | (57.8-82.7%) | 68.3% | (51.9-81.9%) | 73.1% | (52.2-88.4%) | |||||
| Blood Lipid - Cholesterol (mg/dL) | n=583 | n=162 | n=128 | n=293 | n=276 | n=163 | |||||||||||
| % total patients with blood lipid test | 30.2% | (27.2-33.4%) | 29.2% | (23.8-35.2%) | 12.2% | (8.6-16.6%) | 46.2% | (40.8-51.8%) | < 0.001 | 29.4% | (25.0-34.1%) | 44.5% | (37.8-51.4%) | 0.003 | |||
| n=263 | n=76 | n=34 | n=153 | n=119 | n=97 | ||||||||||||
| Mean | 204 | (198-210) | 218 | (207-229) | 222 | (201-243) | 194 | (186-200) | < 0.001 | 204 | (196-212) | 195 | (186-205) | 0.167 | |||
| Cholesterol<200 mg/dL “GOAL” | 46.4% | (40.2-52.6%) | 35.5% | (24.9-47.3%) | 38.2% | (22.2-56.4%) | 53.6% | (45.4-61.7%) | 0.042 | 42.9% | (33.8-52.3%) | 56.7% | (46.3-66.7%) | 0.129 | |||
| Cholesterol=200-239 mg/dL “CAUTION” | 33.1% | (27.4-39.1%) | 35.5% | (24.9-47.3%) | 35.3% | (19.7-53.5%) | 31.4% | (24.1-39.4%) | 37.0% | (28.3-46.3%) | 27.8% | (19.2-37.9%) | |||||
| Cholesterol>240 mg/dL “RISK” | 20.5% | (15.8-25.9%) | 28.9% | (19.1-40.5%) | 26.5% | (12.9-44.4%) | 15.0% | (9.8-21.7%) | 20.2% | (13.4-28.5%) | 15.5% | (8.9-24.2%) | |||||
| Hypertension | n=755 | n=206 | n=238 | n=311 | n=353 | n=185 | |||||||||||
| Total % HT patients with BP measured | 49.1% | (45.5-52.8%) | 35.9% | (29.4-42.9%) | 22.3% | (17.1-28.1%) | 78.5% | (73.5-82.9%) | < 0.001 | 60.1% | (54.7-65.2%) | 62.7% | (55.3-69.7%) | 0.550 | |||
| n=371 | n=74 | n=53 | n=244 | n=212 | n=116 | ||||||||||||
| Controlled: BP<140/90 mmHg | 64.2% | (59.0-69.0%) | 47.3% | (35.6-59.3%) | 39.6% | (26.5-54.0%) | 74.6% | (68.6-79.9%) | < 0.001 | 59.9% | (53.0-66.6%) | 74.1% | (65.2-81.8%) | 0.028 | |||
| Uncontrolled: Systolic BP > 140 mmHg (Diastolic BP < 90) | 21.8% | (17.7-26.4%) | 32.4% | (22.0-44.3%) | 22.6% | (12.3-36.2%) | 18.4% | (13.8-23.9%) | 24.5% | (18.9-30.9%) | 17.2% | (10.9-25.4%) | |||||
| Uncontrolled: Diastolic BP > 90 mmHg (Systolic BP<140) | 1.9% | (0.8-3.8%) | 1.4% | (0.0-7.3%) | 7.5% | (2.1-18.2%) | 0.8% | (0.1-2.9%) | 1.4% | (0.3-4.1%) | 2.6% | (0.5-7.4%) | |||||
| Uncontrolled: BP>140/90 mmHg | 12.1% | (9.0-15.9%) | 18.9% | (10.7-29.7%) | 30.2% | (18.3-44.3%) | 6.1% | (3.5-9.9%) | 14.2% | (9.8-19.6%) | 6.0% | (2.5-12.0%) | |||||
| Systolic blood pressure | n=379 | n=79 | n=53 | n=247 | n=218 | n=117 | |||||||||||
| Mean (in mmHg) | 138 | (136-140) | 148 | (143-153) | 150 | (144-156) | 132 | (130-134) | < 0.001 | 140 | (137-143) | 133 | (130-136) | 0.003 | |||
| BP < 140 mmHg | 47.5% | (42.4-52.7%) | 26.6% | (17.3-37.7%) | 28.3% | (16.8-42.3%) | 58.3% | (51.9-64.5%) | < 0.001 | 43.6% | (36.9-50.4%) | 53.8% | (44.4-63.1%) | 0.011 | |||
| BP 140-149 mmHg | 20.3% | (16.4-24.7%) | 19.0% | (11.0-29.4%) | 24.5% | (13.8-38.3%) | 19.8% | (15.1-25.4%) | 19.3% | (14.3-25.1%) | 24.8% | (17.3-33.6%) | |||||
| BP 150-159 mmHg | 12.7% | (9.5-16.4%) | 17.7% | (10.0-27.9%) | 9.4% | (3.1-20.7%) | 11.7% | (8.0-16.4%) | 12.8% | (8.7-18.0%) | 12.8% | (7.4-20.3%) | |||||
| BP 160-169 mmHg | 10.0% | (7.2-13.5%) | 13.9% | (7.2-23.5%) | 13.2% | (5.5-25.3%) | 8.1% | (5.0-12.2%) | 11.9% | (7.9-17.0%) | 5.1% | (1.9-10.8%) | |||||
| BP>170 mmHg | 9.5% | (6.7-12.9%) | 22.8% | (14.1-33.6%) | 24.5% | (13.8-38.3%) | 2.0% | (0.7-4.7%) | 12.4% | (8.3-17.5%) | 3.4% | (0.9-8.5%) | |||||
| Diastolic Blood Pressure | n=372 | n=74 | n=54 | n=244 | n=213 | n=116 | |||||||||||
| Mean (in mmHg) | 81 | (79-82) | 85 | (83-88) | 88 | (84-93) | 78 | (76-79) | < 0.001 | 82 | (80-83) | 78 | (76-80) | 0.023 | |||
| BP < 90 mmHg | 71.2% | (66.3-75.8%) | 44.6% | (33.0-56.6%) | 46.3% | (32.6-60.4%) | 84.8% | (79.7-89.1%) | < 0.001 | 68.5% | (61.8-74.7%) | 80.2% | (71.7-87.0%) | 0.074 | |||
| BP 90-99 mmHg | 17.7% | (14.0-22.0%) | 36.5% | (25.6-48.5%) | 29.6% | (18.0-43.6%) | 9.4% | (6.1-13.8%) | 18.8% | (13.8-24.7%) | 12.9% | (7.4-20.4%) | |||||
| BP 100-109 mmHg | 8.9% | (6.2-12.2%) | 16.2% | (8.7-26.6%) | 14.8% | (6.6-27.1%) | 5.3% | (2.9-8.9%) | 9.9% | (6.2-14.7%) | 6.9% | (3.0-13.1%) | |||||
| BP > 110 mmHg | 2.2% | (0.9-4.2%) | 2.7% | (0.3-9.4%) | 9.3% | (3.1-20.3%) | 0.4% | (0.0-2.3%) | 2.8% | (1.0-6.0%) | 0.0% | (0.0-3.1%) | |||||
| Overalla | By Region | P-value for regional comparisonb | By Population | P-value for population comparisonb | ||||||||||
|---|---|---|---|---|---|---|---|---|---|---|---|---|---|---|
| (n=870) | South (n=260) | Bekaa (n=279) | GB/ML (n=331) | Syrian(n=637) | Lebanese (n=330) | |||||||||
| Point | 95% CI | Point | 95% CI | Point | 95% CI | Point | 95% CI | Point | 95% CI | Point | 95% CI | |||
| Diabetes | n=460 | n=137 | n=142 | n=181 | n=198 | n=136 | – | |||||||
| % of diabetes patients with blood test resultsc | 37.6% | (33.2-42.2%) | 21.9% | (15.3-29.8%) | 21.8% | (15.3-29.5%) | 61.9% | (54.4-69.0%) | < 0.001 | 37.3% | (30.6-44.4%) | 48.6% | (40.0-57.2%) | 0.039 |
| n=170 | n=30 | n=31 | n=109 | – | n=73 | n=66 | – | |||||||
| Controlled | 43.5% | (36.0-51.3%) | 43.3% | (25.5-62.6%) | 12.9% | (3.6-29.8%) | 52.3% | (42.5-61.9%) | < 0.001 | 45.2% | (33.5-57.3%) | 53.0% | (40.3-65.4%) | 0.357 |
| Uncontrolled | 56.5% | (48.7-64.0%) | 56.7% | (37.4-74.5%) | 87.1% | (70.2-96.4%) | 47.7% | (38.1-57.5%) | 54.8% | (42.7-66.5%) | 47.0% | (34.6-59.7%) | ||
| HbA1C | n=460 | n=137 | n=142 | n=181 | – | n=198 | n=136 | – | ||||||
| % of diabetes patients with HbA1C test | 33.3% | (29.0-37.8%) | 21.9% | (15.3-29.8%) | 14.8% | (9.4-21.7%) | 56.4% | (48.8-63.7%) | < 0.001 | 34.3% | (27.8-41.4%) | 47.1% | (38.4-55.8%) | 0.057 |
| n=153 | n=30 | n=21 | n=102 | – | n=68 | n=64 | – | |||||||
| Mean | 7.3 | (7.1-7.5) | 7.5 | (6.9-8.1) | 8.2 | (7.6-8.8) | 7.0 | (6.8-7.2) | < 0.001 | 7.3 | (6.9-7.6) | 7.0 | (6.7-7.4) | 0.284 |
| HbA1C<7.0% | 48.4% | (40.2-56.6%) | 43.3% | (25.5-62.6%) | 19.0% | (5.4-41.9%) | 55.9% | (45.7-65.7%) | < 0.001 | 48.5% | (36.2-61.0%) | 54.7% | (41.7-67.2%) | 0.709 |
| HbA1C = 7.0-7.9% | 21.6% | (15.3-28.9%) | 16.7% | (5.6-34.7%) | 14.3% | (3.0-36.3%) | 24.5% | (16.5-34.0%) | 22.1% | (12.9-33.8%) | 21.9% | (12.5-34.0%) | ||
| HbA1C > 8.0% | 30.1% | (22.9-38.0%) | 40.0% | (22.7-59.4%) | 66.7% | (43.0-85.4%) | 19.6% | (12.4-28.6%) | 29.4% | (19.0-41.7%) | 23.4% | (13.8-35.7%) | ||
| Blood Sugar | – | – | – | – | – | – | – | – | – | – | – | – | – | – |
| Random Blood Sugar (Blood Glucose) | n=460 | n=137 | n=142 | n=181 | – | n=198 | n=136 | – | ||||||
| % of diabetes patients with random blood sugar test | 9.1% | (6.7-12.1%) | 0% | (0.0-2.7%) | 0% | (0.0-2.6%) | 23.2% | (17.3-30.0%) | < 0.001 | 7.1% | (3.9-11.6%) | 19.9% | (13.5-27.6%) | 0.001 |
| n=42 | n=0 | n=0 | n=42 | – | n=14 | n=27 | – | |||||||
| Mean | 158 | (145-171) | – | – | – | – | 158 | (145-171) | – | 163 | (137-189) | 158 | (143-173) | 0.712 |
| Random Blood Sugar < 120mg/dL | 14.3% | (5.4-28.5%) | – | – | – | – | 14.3% | (5.4-28.5%) | – | 7.1% | (0.2-33.9%) | 14.8% | (4.2-33.7%) | 0.477 |
| Random Blood Sugar > 120mg/dL | 85.7% | (71.5-94.6%) | – | – | – | – | 85.7% | (71.5-94.6%) | 92.9% | (66.1-99.8%) | 85.2% | (66.3-95.8%) | ||
| Fasting Blood Sugar (Blood Glucose) | n=460 | n=137 | n=142 | n=181 | – | n=198 | n=136 | – | ||||||
| % of diabetes patients with fasting blood sugar test | 24.8% | (20.9-29.0%) | 0.7% | (0.0-4.0%) | 16.9% | (11.1-24.1%) | 49.2% | (41.7-56.7%) | < 0.001 | 19.7% | (14.4-25.9%) | 36.8% | (28.7-45.5%) | 0.003 |
| n=114 | n=1 | n=24 | n=89 | – | n=39 | n=50 | – | |||||||
| Mean | 146 | (138-154) | 90 | – | 174 | (155-194) | 139 | (131-147) | 0.001 | 145 | (132-158) | 137 | (126-149) | 0.385 |
| Fasting Blood Sugar < 100mg/dL | 12.3% | (6.9-19.7%) | 100% | (2.5-100.0%) | 4.2% | (0.1-21.1%) | 13.5% | (7.2-22.4%) | 0.013 | 10.3% | (2.9-24.2%) | 16.0% | (7.2-29.1%) | 0.431 |
| Fasting Blood Sugar > 100mg/dL | 87.7% | (80.3-93.1%) | 0% | (0.0-97.5%) | 95.8% | (78.9-99.9%) | 86.5% | (77.6-92.8%) | 89.7% | (75.8-97.1%) | 84.0% | (70.9-92.8%) | ||
3.3.1. Hypertension
Blood Pressure (BP) was recorded for 49.1% (CI: 45.5-52.8) of patients with hypertension at baseline, and reporting was significantly higher in Beirut/Mount Lebanon (78.5%) as compared to the South (35.9%) and the Bekaa (22.3%) (p<0.001), but similar by population group (p=0.550). Average systolic BP among patients with hypertension was 138mmHg (CI: 136-140; median=140) and average diastolic blood pressure was 81mm (CI: 79-82; median=80). Overall, 64.2% (CI: 59.0-69.9) of patients with hypertension were classified as having normal BP (lower than 140/90mmHg). Uncontrolled BP was separated into three categories based on both systolic and diastolic readings; 21.8% (CI: 17.7-26.4) of patients with hypertension had systolic BP>140mmHg but diastolic BP <90mmHg (elevated systolic BP); 1.9% (CI: 0.8-3.8) had diastolic BP>90mmHg but systolic BP <140, (elevated diastolic BP), and 12.1% (CI: 9.0-15.9%) had BP above 140/90mmHg (elevated overall BP). Differences in BP classification were statistically significantly different across geographic regions; patients with hypertension in Beirut/Mt Lebanon were most likely to have normal BP (74.6%) at enrollment as compared to patients in the South (47.3%) and the Bekaa (39.6%) (p<0.001). In addition, Lebanese patients with hypertension were significantly more likely to have normal BP than Syrian patients (74.1% vs 59.9%, p=0.028) (Fig. 2).
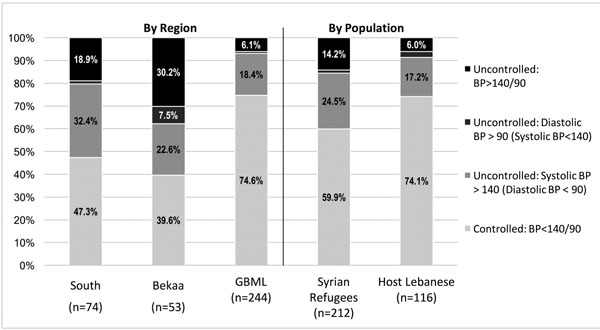 |
Fig. (2). Blood Pressure Control Classification Among Patients with Hypertension. |
3.3.2. Diabetes
Among enrolled patients with diabetes, 37.6% (CI: 33.2-42.2) had blood glucose results (including HbA1C, Random Blood Sugar (RBS), and/or Fasting Blood Sugar (FBS)) reported in health facility records at baseline. Similar to blood pressure, blood glucose reporting was significantly higher in Beirut/Mount Lebanon (56.4%) than in the South (21.9%) and the Bekaa (14.8%) (p<0.001), though unlike blood pressure, blood glucose reporting was higher among Lebanese (48.6%) than among Syrian refugee patients (37.3%) (p=0.039). HbA1C was the most commonly used test, for which results were reported for 38.9% (CI: 33.7-44.4) of patients with diabetes; results of HbA1C, RBS and FBS testing are presented in Table 4. Average HbA1C among patients with diabetes was 7.3% (CI: 7.0-7.5; median=7.0). Overall 43.5% (CI: 36.0-51.3%) of patients with diabetes were classified as having controlled diabetes (HbA1C<7%) and 56.5% (CI: 48.7-64.0%) were classified as uncontrolled. No significant difference in control was observed by nationality; however, patients in the Bekaa were significantly less likely to have HbA1C results indicating diabetes control (19.0%) compared to the South (43.5%) and Beirut/Mt Lebanon (55.9%).
3.4. Odds of Hypertension Control
Factors associated with control of hypertension were assessed in univariate and multivariate models; however, few significant associations were observed (Table 5). In univariate models for hypertension, age, nationality, region, residence location, and crowding (an economic status proxy) were significantly associated with hypertension control, but only nationality and region remained significant after accounting for other variables in the multivariate model. Syrian refugee patients with hypertension were 2.4 (CI:1.3-4.6) times more likely to have uncontrolled blood pressure than Lebanese and those receiving care in the South were 3.7 (CI: 1.3-10.3) times more likely to have uncontrolled blood pressure than those in Beirut/Mt Lebanon.
| Controlled BP | Uncontrolled BPa | P-valueb | Odds of Uncontrolled BPa | ||
|---|---|---|---|---|---|
|
Crude OR (95% CI)c |
Adjusted OR (95% CI)d |
||||
| (N= 237) | (N= 133) | ||||
| Individual Condition/Patient Characteristics | |||||
| Diagnosed comorbidity (hypertension & type 2 diabetes) | 50.20% | 47.40% | 0.600 | 1.12 (0.73,1.71) | 0.76 (0.44,1.32) |
| Time since diagnosis (in years) | |||||
| < 2 years | 9.90% | 9.80% | 0.316 | Reference | Reference |
| 2 - 4.9 years | 26.20% | 19.60% | 1.33 (0.55,3.22) | 1.06 (0.37,3.03) | |
| 5 - 9.9 years | 32.20% | 38.40% | 0.83 (0.36,1.91) | 0.65 (0.24,1.74) | |
| 10 - 14.9 years | 15.80% | 21.40% | 0.73 (0.3,1.82) | 0.8 (0.28,2.32) | |
| 15+ years | 15.80% | 10.70% | 1.47 (0.54,3.95) | 1.28 (0.39,4.17) | |
| Age (in years) | |||||
| 40 - 49 years | 15.60% | 19.70% | 0.754 | Reference | Reference |
| 50 - 59 years | 38.00% | 35.60% | 1.35 (0.73,2.48) | 0.88 (0.39,1.97) | |
| 60 - 69 years | 29.10% | 26.50% | 1.39 (0.73,2.64) | 0.76 (0.33,1.79) | |
| 70+ years | 17.30% | 18.20% | 1.2 (0.59,2.44) | 0.69 (0.26,1.84) | |
| Gender | |||||
| Male | 40.90% | 29.30% | 0.026 | Reference | Reference |
| Female | 59.10% | 70.70% | 0.60 (0.38,0.94) | 0.74 (0.41,1.35) | |
| Population Group | |||||
| Host Community | 39.60% | 23.20% | 0.002 | Reference | Reference |
| Syrian Refugee | 60.40% | 76.80% | 2.17 (1.32,3.57) | 2.43 (1.29,4.56) | |
| Highest Education Level Completed | |||||
| Less than Primary | 62.90% | 65.40% | 0.847 | Reference | Reference |
| Primary | 25.30% | 24.80% | 1.06 (0.64,1.75) | 1.03 (0.53,1.99) | |
| Secondary | 9.30% | 6.80% | 1.43 (0.63,3.24) | 1.21 (0.41,3.58) | |
| University or higher | 2.50% | 3.00% | 0.88 (0.24,3.19) | 0.53 (0.1,2.88) | |
| Household Characteristics | |||||
| Region of Residence | |||||
| Beirut/Mt. Lebanon | 14.80% | 28.60% | < 0.001 | Reference | Reference |
| Bekaa | 8.40% | 24.80% | 0.66 (0.32,1.35) | 0.96 (0.4,2.34) | |
| South | 76.80% | 46.60% | 3.19 (1.85,5.48) | 3.71 (1.34,10.3) | |
| Residence Area | |||||
| Urban | 80.60% | 58.30% | < 0.001 | Reference | Reference |
| Rural | 19.40% | 41.70% | 0.34 (0.21,0.54) | 1.01 (0.39,2.57) | |
| Crowdinge | 10.60% | 21.10% | 0.006 | 0.44 (0.25,0.8) | 0.75 (0.35,1.61) |
| Socioeconomic Quartilef | |||||
| Bottom | 19.40% | 21.80% | 0.501 | Reference | Reference |
| 2nd | 24.90% | 27.10% | 1.03 (0.55,1.93) | 0.77 (0.34,1.75) | |
| 3rd | 25.70% | 28.60% | 1.01 (0.55,1.87) | 0.61 (0.27,1.4) | |
| Top | 30.00% | 22.60% | 1.49 (0.79,2.8) | 0.72 (0.31,1.69) | |
a Uncontrolled blood pressure (BP) characterized as systolic BP > 140 and/or diastolic BP>90mmHg
b Independent t-test for continuous variables, Chi-square test for categorical variables
c Bold indicates statistically significant (p < 0.10) findings
d Bold indicates statistically significant (p < 0.05) findings
e 5+ people per sleeping room
f Based on monthly expenditures
4. DISCUSSION
The capacity of Lebanon’s health system to support the needs of the Syrian refugee population is becoming increasingly strained despite substantial investment and widespread effort to build the capacity of public institutions [22, 23]. Among patients with hypertension and diabetes in this study, Syrian refugees were significantly less likely to have had a prior diagnosis (i.e. to be diagnosed at the visit that led to their study enrollment) for both conditions. This may be tied to the older average age of Lebanese patients enrolled in the study as compared to Syrian refugee patients, but may also reflect poor access or quality of care while in Syria and/or low quality or restricted access to care in Lebanon. Previous findings concerning care-seeking rates among Syrian refugees vary with one study indicating that more than half of households that have members with NCDs are unable to access medicines or related NCD services, while another estimated care-seeking rates at 81% for hypertension and 88% for diabetes [18, 20]. The proportion of individuals with hypertension and diabetes that reported seeking care in the later study was significantly lower among refugees as compared to Lebanese host community members [21]. This disparity is a likely contributor to the higher proportion of new hypertension and diabetes diagnoses observed among Syrian patients as compared to Lebanese in our sample.
In spite of subsidized care available to Syrian refugees for a fee of 3,000 to 5,000 LBP (approximately US$2 to US$3) per visit in over 1200 primary health centers and dispensaries throughout Lebanon, an estimated 39% of Syrian refugees are reportedly not receiving needed medical care because of associated costs [19, 25, 27, 30]. Many Lebanese face similar challenges in accessing affordable health services, where slightly more than half have no formal health insurance coverage [23, 43]. The less affluent and uninsured Lebanese seek care in a network of both public and private health centers, including the MoPH network, which provides reduced cost care for low income Lebanese [25]. Previous findings show that cost is a barrier to care seeking for both Syrian refugees and Lebanese host community members with NCDs; however, a recent survey estimated that 63% of Lebanese with chronic medical conditions sought care at private health centers, demonstrating that Lebanese are more likely to utilize private health facilities when possible, despite the associated higher costs for care [21]. In the same study, both the frequency and amounts of out-of-pocket payments for care were reportedly lower among refugees than host community members, suggesting that current humanitarian support is contributing to maintaining refugee access to NCD care [21].
NCD consultations and medications were offered at low or no cost to both Lebanese and Syrian patients at study health centers and while out-of-pocket payments were not recorded in this study, it is evident from high levels of asset sales and borrowing among refugee patients and debt among refugees and Lebanese alike that financial limitations may affect patients’ care-seeking decisions and ability to afford diagnostics tests and medications, which may not be subsidized. The proportion of newly diagnosed hypertension and diabetes cases was lowest in the Bekaa (for both conditions), as were household incomes and expenditures, while the frequency of borrowing was highest in the Bekaa as compared to Beirut/Mt Lebanon and the South. This is a further suggestion that cost may be a barrier to care, and one that is likely significant enough to delay diagnosis and possibly continuity of care over time. Inability to afford medications may also contribute to the higher rates of interrupted medication use among Syrians that were observed for both hypertension and diabetes patients [32, 44].
The frequency of BMI, cholesterol, blood pressure, and blood sugar reporting was greatest in Beirut/Mt Lebanon, intermediate in the South, and lowest in the Bekaa. When patterns of control were assessed, the proportion of patients with their condition controlled was significantly higher in Beirut/Mt Lebanon as compared to the other regions for cholesterol, hypertension, and diabetes. These findings indicate that access to care and/or quality of care may be higher in Beirut/Mt Lebanon than in the other regions. Improvements in clinical management, such as ensuring that physical and laboratory values are sought and recorded, are a basic practice that should be expanded to improve quality of care. It is possible that cost is a barrier to patients following up on ordered laboratory tests, where such tests are not always subsidized; however, that only 7.7% of participants had BMI reported suggest that inconsistent clinical care practices are also a contributing factor to the low proportion of participants with biometric information recorded in health facility records.
While only three to four clinics participated in the study in each region and results cannot be generalized on a regional basis, participating facilities were perceived as relatively representative of the types of locations where Syrian refugees and less affluent host community Lebanese seek care. When reporting completeness is used as an indicator of quality, our findings suggest that quality of care for NCDs in primary health care settings in Lebanon is low. Considerable efforts are ongoing to bolster the capacity of the Lebanese health system, which will benefit both Syrian refugees and Lebanese. With respect to care for NCDs such as hypertension and diabetes, select health facilities providing subsidized care are mandated to offer services for non-communicable disease prevention, screening, regular follow-up monitoring, and essential medicines; however, little is known about the quality of care for NCDs in MoPH network and other out-of-network health facilities. Further efforts to examine quality of care issues and build capacity to improve quality of care are needed. Disease control could be documented in 64.2% of patients with hypertension and 43.5% of patients with type 2 diabetes [with laboratory results available], further suggesting the need to examine issues such as frequency of care, access barriers, and lifestyle behaviors, all of which contribute to health outcomes in hypertension and type 2 diabetes.
LIMITATIONS
Reliance on self-reported data for many variables of interest may result in bias, particularly for questions about treatment adherence where respondents may be aware of attitudes and perceptions about the importance of adhering to prescribed treatments. Recall of the time of initial diagnosis of hypertension or diabetes may not be accurate. Limiting the study sample to individuals seeking care at study health facilities, while necessary for the main study objectives, is a limitation for the purpose of this research in that it limits representativeness to a small subset of the population of Syrian refugees and host communities in Lebanon who sought care in these locations. The prevalence of hypertension and type 2 diabetes is likely to be much higher in the community than only those recruited for the study without an additional screening of the general population, and persons receiving care from private clinics, pharmacies, or Syrian doctors practicing within the refugee community may well have different findings. As such, results are not necessarily applicable to all patients with hypertension or diabetes who are not receiving care, or who receive care at different types of health facilities or in other geographic areas of Lebanon. This is limiting because outcomes among patients not receiving care could be presumed to be far worse than in patients receiving some level of care; however, results from this research can neither confirm nor preclude those assumptions. Finally, models assessing disease control did not include all factors known to influence the outcome measure such as number and types of medications, co-morbidities and lifestyle behaviors, and would have likely accounted for more variance if additional predictor variables were included.
CONCLUSION
Approaches to providing health care to refugees with hypertension and type 2 diabetes are needed that will improve access to care and the quality of care provided. Observed differences between Syrian and Lebanese patients and between patients in different regions could inform strategies aimed at improving diagnosis and quality of care for hypertension and diabetes in primary care settings in Lebanon. Findings from this study suggest that undiagnosed cases of hypertension and type 2 diabetes are not uncommon and that quality of care, as measured by the proportion of patients with recorded biometrics and whose condition is controlled, is less than ideal and varied by geographic location. While efforts to improve quality of care for NCDs, such as the MoPH’s recent update of treatment guidelines, are underway, significant challenges remain to realizing widespread improvements in quality of care for NCDs in primary health facilities. Engaging professional societies to support efforts to ensure consistency and completeness of care for patients with NCDs and additional quality improvement assurance strategies are complementary approaches that could be used to increase uptake of MoPH treatment guidelines.
Improving the treatment of hypertension and diabetes is critical for preventing complications and reducing the need for tertiary care, both of which can be devastating to vulnerable households. Continued efforts to build capacity of health service providers to manage common NCDs such as diabetes and hypertension and ensuring access to affordable consultations, diagnostic testing, and medicines are critical components to addressing the increasing burden of NCDs in Lebanon and improving the health of populations with chronic medical conditions such as diabetes and hypertension.
ETHICS APPROVAL AND CONSENT TO PARTICIPATE
This study was approved by the Ministry of Public Health in Lebanon and the Institutional Review Board at The Johns Hopkins Bloomberg School of Public Health IRB reference number: 00006059.
HUMAN AND ANIMAL RIGHTS
No Animals were used in this research. All human research procedures followed were in accordance with the ethical standards of the committee responsible for human experimentation (institutional and national), and with the Helsinki Declaration of 1975, as revised in 2013.
CONSENT FOR PUBLICATION
Verbal informed consent was obtained and documented in survey forms.
CONFLICT OF INTEREST
The authors declare that there is no conflict of interest.
FUNDING
This research was funded by Research for Health in Humanitarian Crisis (R2HC; http://www.elrha.org/r2hc/home/) under grant number 118412. The funding body had no role in the design or implementation of the research and did not participate in analysis or presentation of findings.
ACKNOWLEDGEMENTS
We would like to express our utmost gratitude to the staff at the ten health facilities that participated in this study—without their dedication and support, this work would have not been possible. We are also grateful to the data collection team and our many colleagues at Johns Hopkins School of Public Health, the International Organization for Migration, and Massachusetts Institute of Technology Sana mHealth Group for their contributions to the project.
All authors participated and approved the paper prior to submission. SD led the design of the study and preparation of the manuscript; EL oversaw study implementation and data collection, led data analysis, and contributed to preparation of the manuscript; ZF, KK, and AM assisted with field implementation of the overall study and supported contextualization of findings, and GB contributed to the design of the study and preparation of the manuscript. All authors critically reviewed the manuscript.
REFERENCES
| [1] | United Nations High Commissioner for Refugees (UNHCR). Syria regional response - Inter-agency information sharing portal Available from: http://data.unhcr.org/syrianrefugees/regional.php [cited 2015 February 15] |
| [2] | United Nations High Commissioner for Refugees. Global trends – forced displacement in 2015 Available from 2016. http://www.unhcr.org/ statistics/unhcrstats/576408cd7/ unhcr-global-trends-2015.html |
| [3] | Amara AH, Aljunid SM. Noncommunicable diseases among urban refugees and asylum-seekers in developing countries: A neglected health care need. Globalization and Health [Internet] Available from: 2014; 10: 268. |
| [4] | Skopec C, Valeeva N, Baca MJ. Anticipating the unexpected: Urban refugee programming in Jordan Available from: 2010.http://www.internationalmedicalcorps.org/ document.doc?id=141 |
| [5] | Shahraz S, Forouzanfar MH, Sepanlou SG, et al. Population health and burden of disease profile of Iran among 20 countries in the region: from Afghanistan to Qatar and Lebanon. Arch Iran Med [Internet] 2014; 17(5): 336. Available from: http://www.ams.ac.ir/AIM/NEWPUB/ 14/17/5/006.pdf |
| [6] | Majeed A, El-Sayed AA, Khoja T, et al. Diabetes in the middle-east and north africa: An update. Diabetes Res Clin Pract [Internet] Available from: 2014; 1.3(2): 218-2. cited 2018 July 3 |
| [7] | Motlagh B, O’Donnell M, Yusuf S. Prevalence of cardiovascular risk factors in the Middle East: A systematic review. Eur J Cardiovasc Prev Rehabil 2009; 16(3): 268-80. |
| [8] | International Diabetes Federation. IDF Diabetes Atlas 2014 Available from: 2014.http://www.idf.org/sites/default/files/ DA-regional-factsheets-2014_FINAL.pdf |
| [9] | Matar D, Frangieh AH, Abouassi S, et al. Prevalence, awareness, treatment, and control of hypertension in Lebanon. J Clin Hypertens (Greenwich) 2015; 17(5): 381-8. |
| [10] | Lim SS, Vos T, Flaxman AD, et al. A comparative risk assessment of burden of disease and injury attributable to 67 risk factors and risk factor clusters in 21 regions, 1990-2010: A systematic analysis for the global burden of disease study 2010. Lancet 2012; 380(9859): 2224-60. |
| [11] | Ramahi T, Khawaja M, Abu-Rmeileh N, Abdulrahim S. Socio-economic disparities in heart disease in the republic of Lebanon: Findings from a population-based study 2010.https://www.ncbi.nlm.nih.gov/pmc/articles/PMC4898496/pdf/heartasia-2009-000851.pdf |
| [12] | Salti IS, Khogali M, Alam S, Abu Haidar N, Masri A. Epidemiology of diabetes mellitus in relation to other cardiovascular risk factors in Lebanon. East Mediterr Health J [Internet] Available from: 1997; 3(3): 462-71.http://apps.who.int/iris/handle/10665/117528 |
| [13] | Hirbli KI, Jambeine MA, Slim HB, Barakat WM, Habis RJ, Francis ZM. Prevalence of diabetes in greater Beirut. Diabetes Care 2005; 28(5): 1262. |
| [14] | Costanian C, Bennett K, Hwalla N, Assaad S, Sibai AM. Prevalence, correlates and management of type 2 diabetes mellitus in Lebanon: Findings from a national population-based study. Diabetes Res Clin Pract 2014; 105(3): 408-15. |
| [15] | Tailakh A, Evangelista LS, Mentes JC, et al. Hypertension prevalence, awareness, and control in Arab countries: A systematic review. Nurs Health Sci [Internet] Available from: 2014. https://www.ncbi.nlm.nih.gov/pmc/articles/PMC4445843/pdf/ nihms692939.pdf |
| [16] | World Health Organization. NCD country profiles: Lebanon Available from: 2014.http://www.who.int/nmh/ countries/lbn_en.pdf |
| [17] | World Health Organization. NCD country profiles: Syrian Arab Republic Available from: 2014.http://www.who.int/nmh/countries/syr_en.pdf |
| [18] | Doocy S, Lyles E, Roberton T, et al. Prevalence and care-seeking for chronic diseases among Syrian refugees in Jordan. BMC Public Health [Internet] Available from: 2015; 15(1): 1097. |
| [19] | United Nations High Commissioner for Refugees. Health access and utilization survey among non-camp refugees in Lebanon Available from: 2014.https://data.unhcr.org/syrianrefugees/download.php?id=7111 |
| [20] | Doocy S, Lyles E, Roberton T, Weiss W, Burnham G. Health access and utilization survey among non-camp Syrian refugees in Jordan. Available from: 2014.http://data.unhcr.org/syrianrefugees/download.php?id=8604 |
| [21] | Doocy S, Lyles E, Hanquart B, Woodman M. Prevalence, care-seeking, and health service utilization for non-communicable diseases among Syrian refugees and host communities in Lebanon. Confl Health [Internet] 2016; 10(1): 21. |
| [22] | Institute of Health Management and Social Protection (IGSPS). National health statistics report in Lebanon Available from 2012.http://www.igsps.usj.edu.lb/docs/ recherche/recueil12en.pdf |
| [23] | World Bank. Lebanon: Economic and social impact assessment of the Syrian conflict Available from 2013.http://www-wds.worldbank.org/ external/default/WDSContentServer/WDSP/IB/ 2013/09/24/000333037_20130924111238/ Rendered/PDF/810980LB0box379831B00P14754500PUBLIC0.pdf |
| [24] | World Bank. Lebanon - Emergency Primary Healthcare Restoration Project Available from: 2016.http://documents.worldbank.org/curated/ en/185271468266958778/pdf/ PAD12050PAD0P15264600PUBLIC00Box391428B.pdf |
| [25] | Ministry of Public Health of Lebanon. Health response strategy: A new approach in 2015 & beyond Available from 2015.http://www.moph.gov.lb/userfiles/files/Strategic%20Plans/HRS-DRAFT8.pdf cited 2016 January 8 |
| [26] | Caritas, International Medical Corps, Government of Lebanon, United nations High Commissioner for Refugees (UNHCR). Report on secondary and tertiary health care, January – June 2013 Available from: 2013.https://data.unhcr.org/syrianrefugees/download.php?id=3286 |
| [27] | Government of Lebanon. Lebanon crisis response plan 2015-2016 Available from: 2014.http://data.unhcr.org/syrianrefugees/ download.php?id=7723 |
| [28] | United Nations High Commissioner for Refugees. Health operational guidance, Lebanon Available from 2013.http://data.unhcr.org/syrianrefugees/ download.php?id=2257 |
| [29] | United Nations High Commissioner for Refugees. Health services for Syrian refugees in Mount Lebanon and Beirut 2015.http://data.unhcr.org/syrianrefugees/download.php?id=8356 |
| [30] | United Nations High Commissioner for Refugees. Inter-Agency Coordination Lebanon https://www.dropbox.com/sh/4wqtdgihu566i9m/ AADqHEHuzRyVoIuEHZ2z9-jua/2.%20Mapping%20and%20P-codes?dl=0&preview=2015_08_05_MASTER+SHEET+Health+Matrix.xlsx |
| [31] | United Nations High Commissioner for Refugees. Health services for Syrian refugees in Mount Lebanon and Beirut 2015.http://www.unhcr.org/syriarrp6 |
| [32] | Lyles E, Doocy S. Syrian refugee and affected host population health access survey in Lebanon 2015. Available from: http://data.unhcr.org/syrianrefugees/ download.php?id=9550 |
| [33] | World Vision. Social cohesion between Syrian refugees and urban host communities in Lebanon and Jordan Available from: 2015.http://www.wvi.org/sites/default/files/Social%20Cohesion%20Report.pdf cited 2016 September 3 |
| [34] | Mackreath H. The role of Lebanese host communities in Syrian refugee assistance 2015 [Available from: 2015.https://odihpn.org/blog/the-role-of- lebanese-host-communities- in-syrian-refugee-assistance |
| [35] | Ammar W, Kdouh O, Hammoud R, et al. Health system resilience: Lebanon and the Syrian refugee crisis. J Global Health 2016; 6(2): 21. |
| [36] | Hourani G, van Vliet S. Regional differences in the conditions of Syrian refugees in Lebanon Available from: 2014.http://civilsociety-centre.org/paper/ regional-differences-conditions- syrian-refugees-lebanon |
| [37] | Doocy S, Paik K, Lyles E, et al. Pilot testing and implementation of a mHealth tool for non-communicable diseases in a humanitarian setting. PLOS Currents Disasters Available from: 2017; 9http://currents.plos.org/disasters/article/pilot-testing-and- implementation-of-a-mhealth-tool-for-non- communicable-diseases -in-a-humanitarian-setting/ |
| [38] | Doocy S, Paik KE, Lyles E, et al. Guidelines and mHealth to improve quality of hypertension and type 2 diabetes care for vulnerable populations in Lebanon: Longitudinal cohort study. JMIR mHealth uHealth [Internet] Available from 2017; 5(10) |
| [39] | Report of the expert committee on the diagnosis and classification of diabetes mellitus. Diabetes Care 1998; 21: 5-14. |
| [40] | American Heart Association. Understanding blood pressure readings Available from: 2014.http://www.heart.org/HEARTORG/ Conditions/HighBloodPressure/AboutHighBloodPressure/Understanding-Blood-Pressure- Readings_UCM_301764_Article.jsp#.WBsNueErKXQ |
| [41] | James PA, Oparil S, Carter BL, et al. 2014 evidence-based guideline for the management of high blood pressure in adults: Report from the panel members appointed to the Eighth Joint National Committee (JNC 8). JAMA [Internet] 2014; 311(5): 507-20. |
| [42] | World Bank. Official exchange rate (LCU per US$, period average) Available from: http://data.worldbank.org/indicator/PA.NUS.FCRF |
| [43] | Central Bureau of Statistics, Ministry of Social Affairs, United Nations Development Fund. The national survey of household living conditions 2004.http://www.cas.gov.lb/images/PDFs/Living%20conditions%20survey%202004.zip |
| [44] | Strong J, Varady C, Chahda N, Doocy S, Burnham G. Health status and health needs of older refugees from Syria in Lebanon. Confl Health 2015; 9 |